The eXtremeDB Performance Monitor
This article is deprecated. Please see the following article instead.
eXtremeDB for HPC includes an HTML-based Performance Monitor that utilizes the Javascript tool Highcharts from Highsoft. Included is one licensed run-time copy with each eXtremeDB for HPC SDK purchased. (If more run-time licenses are required, you must purchase them from http://www.highsoft.com.)
The Performance Monitor consists of:
- an in-memory database
- a monitor thread that collects and stores metrics in the database
- a separate module for the HTTP Viewer (HV) which can display performance counters in a web-based GUI
Any eXtremeDB database can be attached to the monitor which takes "readings" at regular intervals and stores counter values in an in-memory database called "perfmon". These values are then rolled up into metrics that can be viewed using the HTTP Viewer GUI interface described below. The APIs for implementing custom queries of the monitor database are described in the following section.
Also, included in the SDK samples is the source code for
samples/core/23-httpviewpmonthat incorporates the performance monitor, from which the screen shots that follow are taken. This example program demonstrates some usage of the “perfmon” C language API.Performance Monitor APIs
The performance monitor APIs consist of a small set of functions or class methods that implement the following four operations: initialize, get / set options, attach and detach the database. Please use the links below to view detailed explanations for your development environment:
C Performance monitor C API xSQL Performance monitor with xSQL Performance monitor Python API
Performance Metrics
The monitor reads and stores scalar value statistics such as:
error count, connection count, connects, host CPU load, host memory usage, opened transactions, opened cursors, last snapshot size, max connections, database total pages, database free pages, database used pages, database file size, database log file size, database used file size, cache hit count, cache miss count, cache pages allocated, cache pages used, cache pages pinned, cache pages modified, cache pages dirty, cache pages copied, cache pages write delayed.Then, over the entire monitoring period, the monitor calculates and updates aggregated counters so that each of the operations listed is reflected in the values. Most of these values are calculated using simple statistics functions such as:
current(the latest value),min, max, avg, count, total count.The aggregated counters are for operations such as:Disk read, Disk write, Log write, Commit time, Rollback time, Snapshot duration.Performance Monitor Browser Interface
This article is deprecated. Please see the following article instead.
To view the performance monitor interface, please build and run the example
samples/core/23-httpviewpmon, then open your browser and specify the URLhttp://localhost:8082/.This will bring up the main (initial) performance monitor window:
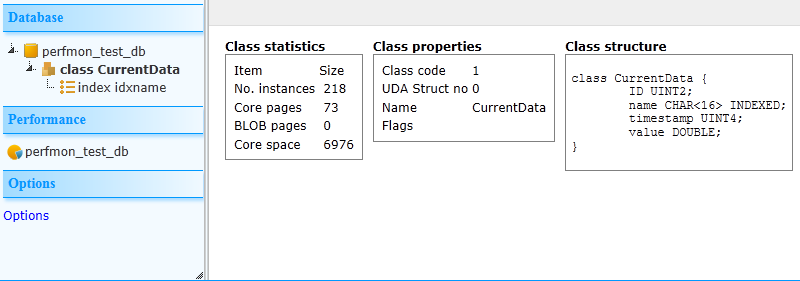
Each class in the database can be explored:
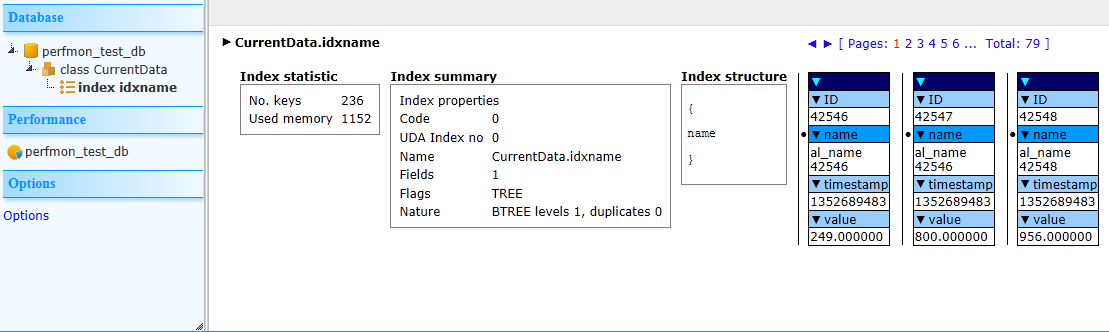
And each index for each class:
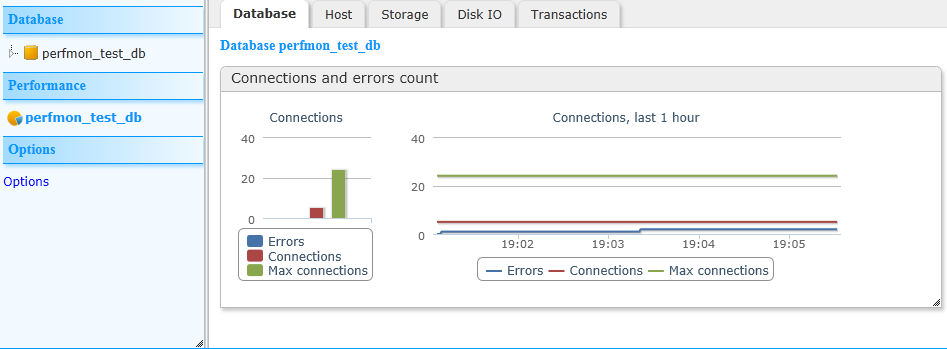
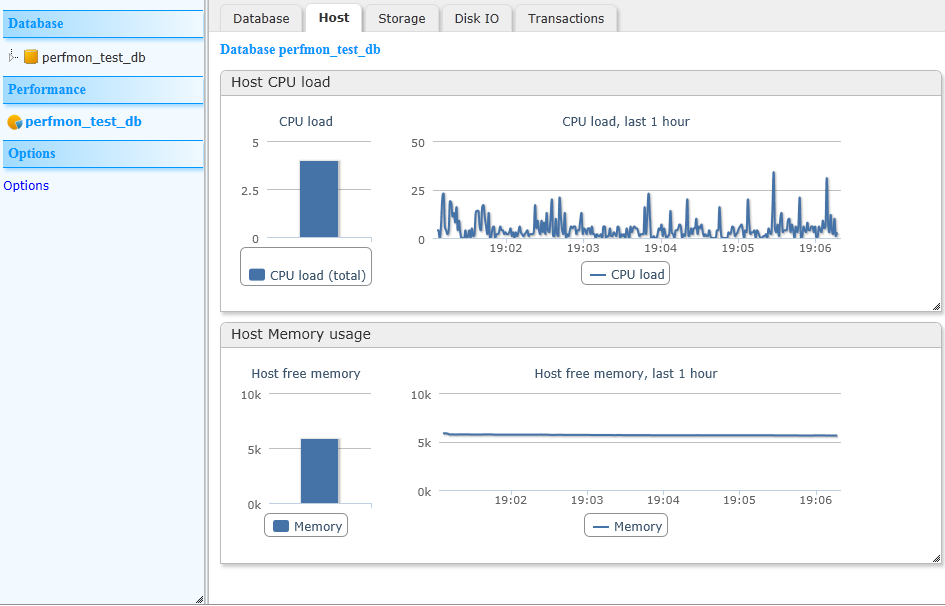
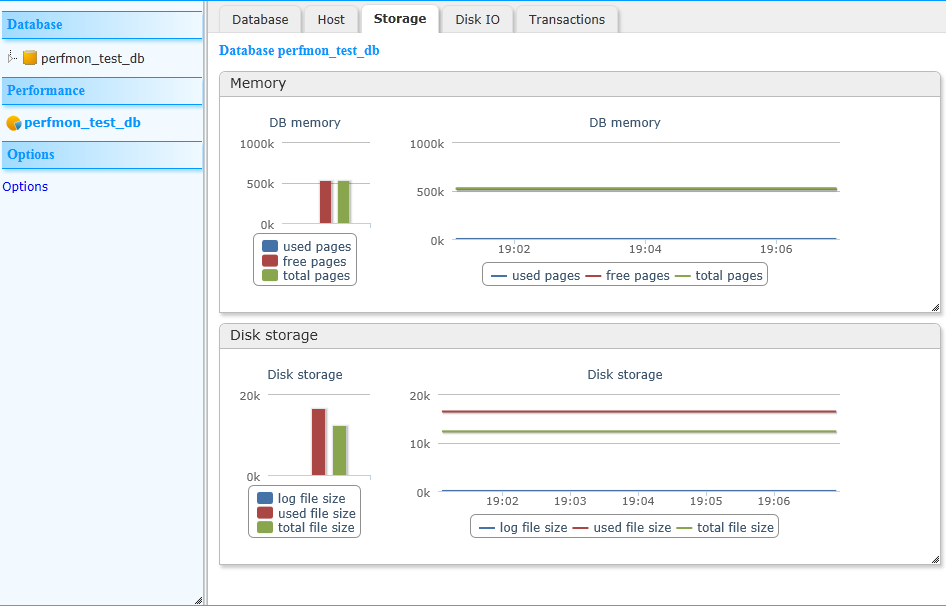
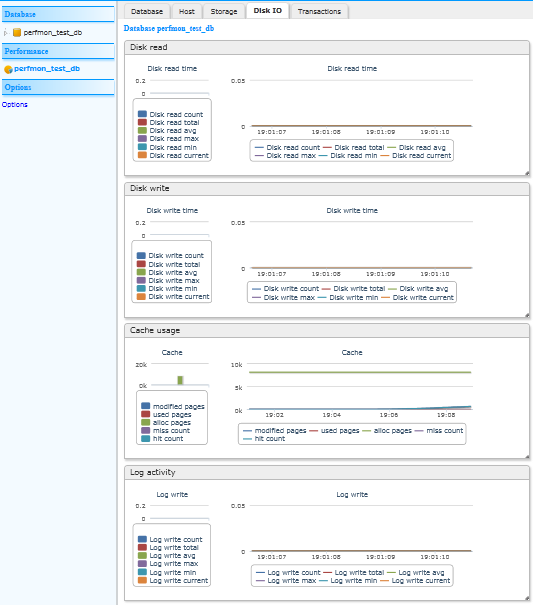
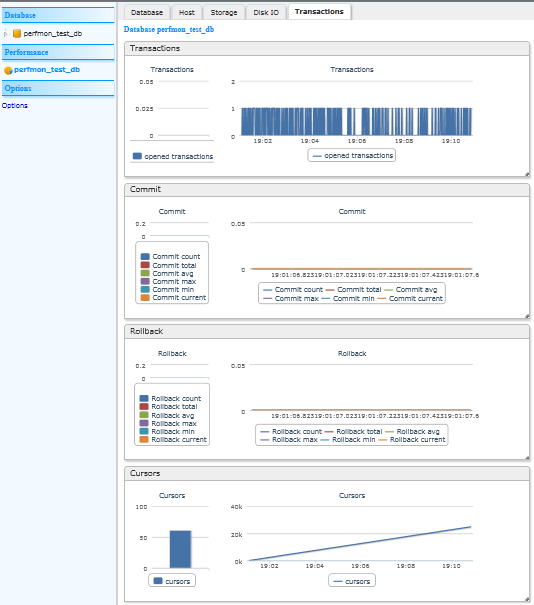
Clicking on the database name under “Performance” in the left pane opens this tabbed window. Clicking on the tabs displays the following performance statistics:
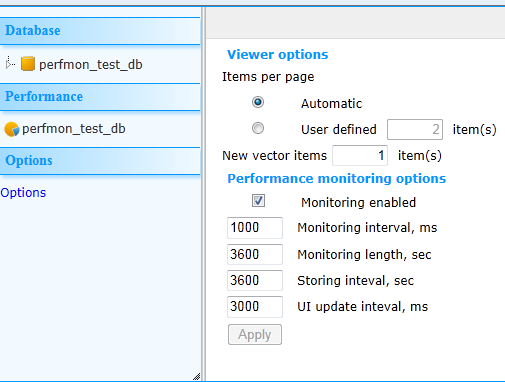
Clicking on “Options” allows you to control certain run-time options of the performance monitor: