SQL Sequence Window Aggregate Exponential Moving Average (EMA) Function
The
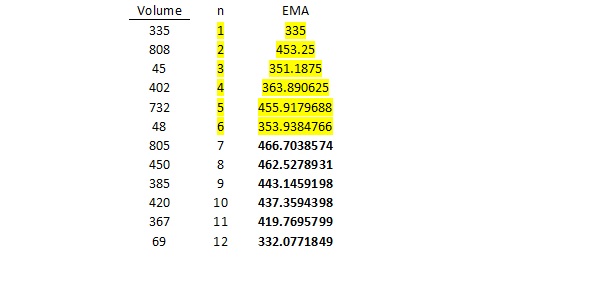
seq_window_agg_ema()function produced byseq_window_agg_ema()is calculated using the following iterative algorithm, where n is the “number of days” for the moving average (starting with 1):
p = 2 / (interval+1)
EMA[0] = input[0] * p
EMA[n] = EMA[n-1] * (1–p)Note that the first 6 values for
seq_window_agg_ema()(highlighted) should be ignored for this interval of 7. (Please see the Window versus Grid Aggregate page for a more detailed explanation.) The valid windows can be verified using the following table (built with Microsoft Excel version 2010) wherep = 2/8 = 0.25:
Following is an example script demonstrating this function:
    SELECT symbol, seq_search(day, 20130101, 20130331) as Q1_13,
        volume@Q1_13 as "Volume_Q1_13",
        seq_window_agg_ema(volume@Q1_13, 7) as "ema_Q1_13"
    FROM Quote WHERE symbol='SYM0';

    symbol
    Q1_13{}
    Volume_Q1_13
    ema_Q1_13
    ------------------------------------------------------------------------------
    SYM0
    {20130101, 20130104, 20130106, 20130110, 20130123, 20130125,
      20130129, 20130213, 20130214, 20130216, 20130311, 20130326}
    {335, 808, 45, 402, 732, 48, 805, 450, 385, 420, 367, 69}
    {335.000000, 453.250000, 351.187500, 363.890625, 455.917969, 353.938477,
      466.703857, 462.527893, 443.145920, 437.359440, 419.769580, 332.077185}
Sample script
A sample script to demonstrate this
selectstatement using xSQL can be run from thesamples/xsql/scripts/financialdirectory with the following command:g 8